
Ember Inspector
Chrome DevTools extension for debugging and inspecting Ember.js applications.
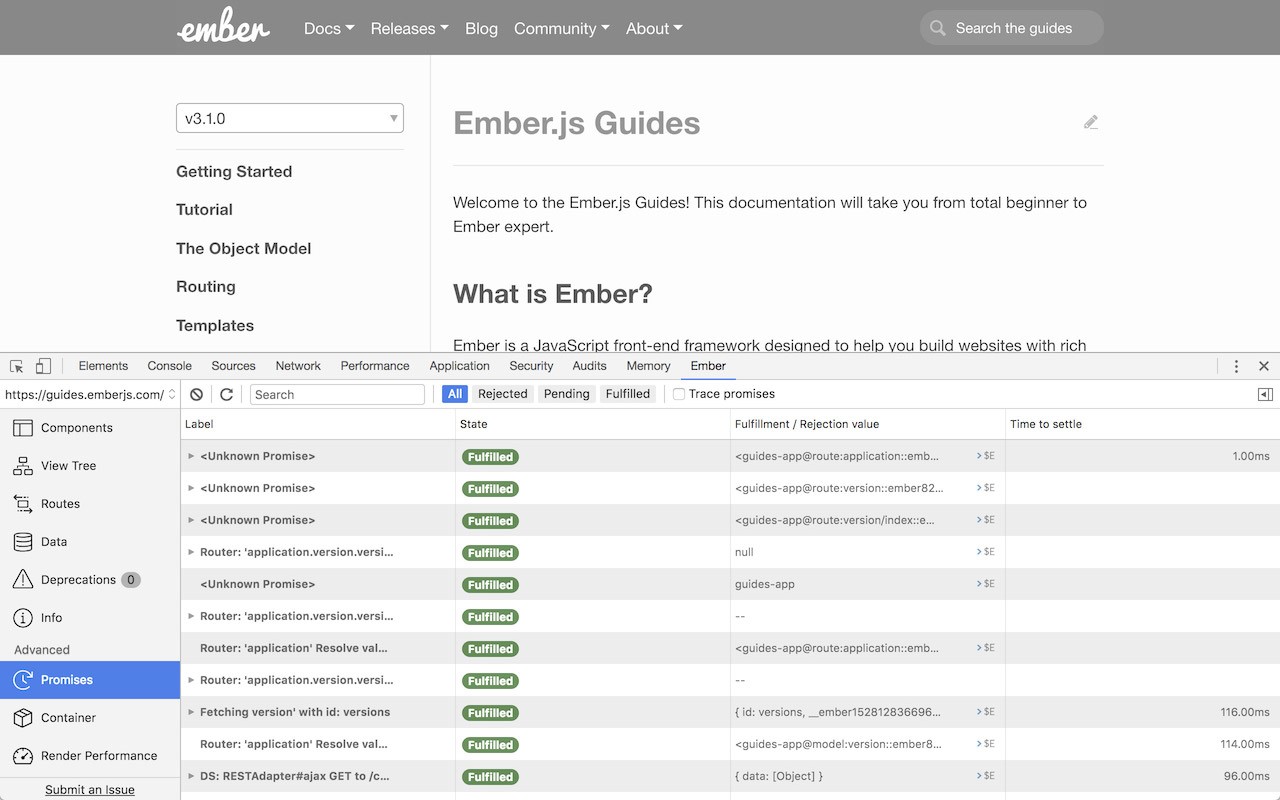
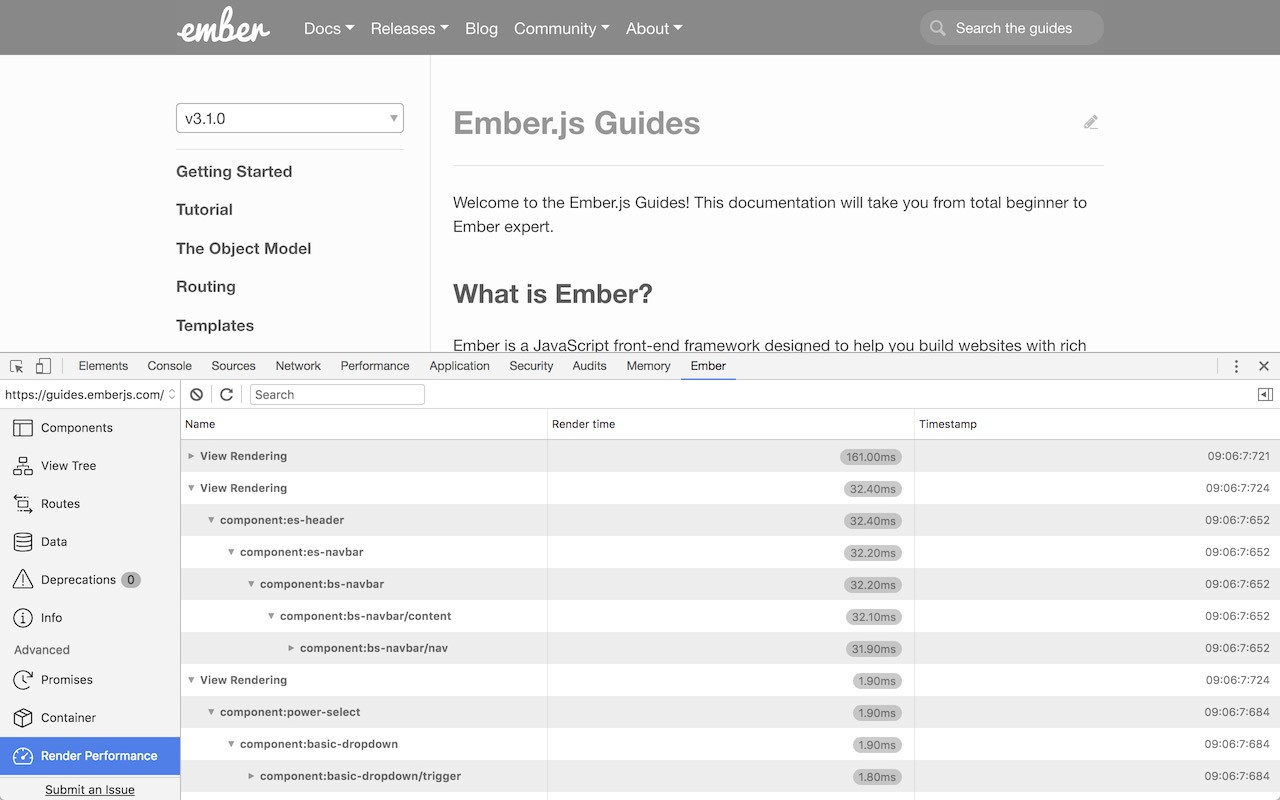
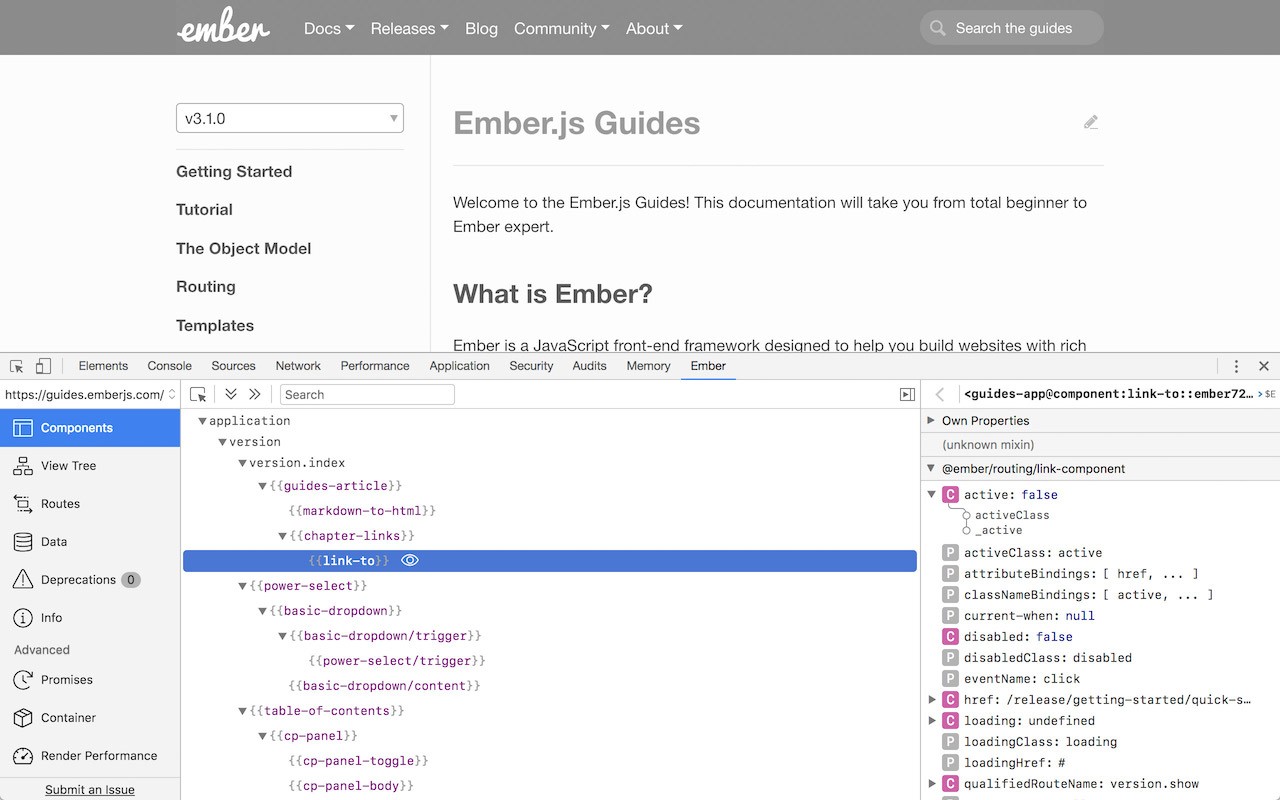
What it does
Permissions and access
Taken from the extension's own manifest file inside the package. The store listing does not spell this out, so it is worth reading before you install.
| Permission | What it allows |
|---|---|
contextMenus | Add items to the right-click menu |
storage | Store its own settings and data |
Requests 2 permissions — extensions doing the same job average 3.9.
Technical details
Description
The Ember Inspector is a developer tool that integrates directly into Chrome's DevTools panel, specifically designed to simplify debugging and inspection of Ember.js applications. By adding this extension, developers gain a dedicated interface for examining application structure, state, and behavior without leaving the browser. It is particularly useful during development when tracking down routing issues, verifying data flow, or understanding how templates and controllers interact at runtime.
Features
- Route Overview: Instantly view all routes defined in your Ember application, including nested routes and dynamic segments. This helps you verify that your route map matches your intended navigation structure and quickly spot missing or misconfigured routes.
- Naming Convention Reference: The inspector surfaces Ember's naming conventions for URLs, controllers, templates, routes, and other key components. When you are unsure what name to use for a new route or template, this feature provides immediate guidance, reducing guesswork and preventing runtime errors.
- Application Overlay: An overlay mode displays real-time information about which templates, controllers, and models are currently being rendered on the page. This is invaluable when debugging complex component hierarchies or verifying that the correct data is associated with a view.
- Object Inspection: Dive into the properties and state of any model, controller, or component instance. The inspector fully supports Ember-specific features like bindings and computed properties, showing their current values and dependencies. You can expand nested objects, inspect arrays, and see how changes propagate through the system.
- Console Integration: Selected application objects are exposed in the Chrome console as the
$Evariable. This allows you to interact with them programmatically-run methods, modify properties, or test computed values-without needing to write custom console logs or breakpoints. - Ember Data Record Viewer: If your application uses Ember Data, the inspector displays all records that have been loaded into the store. You can browse models by type, view attribute values, and see relationships between records. This is especially helpful for verifying that API responses are correctly parsed and stored.
The Ember Inspector is an open-source project maintained by the Ember.js community. Its source code is available on GitHub, welcoming contributions and feedback. Whether you are building a small app or a large-scale Ember project, this tool streamlines the debugging workflow and deepens your understanding of application internals.
Extensions that do the same job
Matched by what these extensions actually do, not by store category, and sorted so the ones asking for the least access come first.
| Extension | Site access | Permissions | Users | Rating |
|---|---|---|---|---|
| Ember Inspector — this page | All sites | 2 | 30K | 4.8★ |
| Figma | Limited | 4 | 200K | 4.2★ |
| GitZip for github | Limited | 2 | 100K | 4.1★ |
| IP Address and Domain Information | Limited | 1 | 100K | 4.4★ |
| Lightning Studio | Limited | 3 | 100K | 3.9★ |
| Pixel Measurement | Limited | 3 | 100K | 4.5★ |
| AI Code Finder, Alerts, Ask Questions about Papers: CatalyzeX | Limited | 3 | 50K | 4.8★ |
Want the same thing with less access? Figma, GitZip for github, IP Address and Domain Information ask for fewer permissions than this one.
Store data last checked August 14, 2026.